
New “Task breakdown by status” widget
Use case
This new widget is an analytics tool for executives and project managers that makes it significantly easier to monitor progress and optimise the team’s workload. It gives you immediate insight into the current stage of each task, allowing you to quickly identify bottlenecks and proactively prevent delays. This eliminates the need to manually analyse lengthy text reports. Users save valuable time by basing their everyday business decisions on clear visual data that supports effective resource management and smooth project delivery.
Description
A new interactive widget has been added to the project analytics module, presenting a task breakdown in a clear chart.
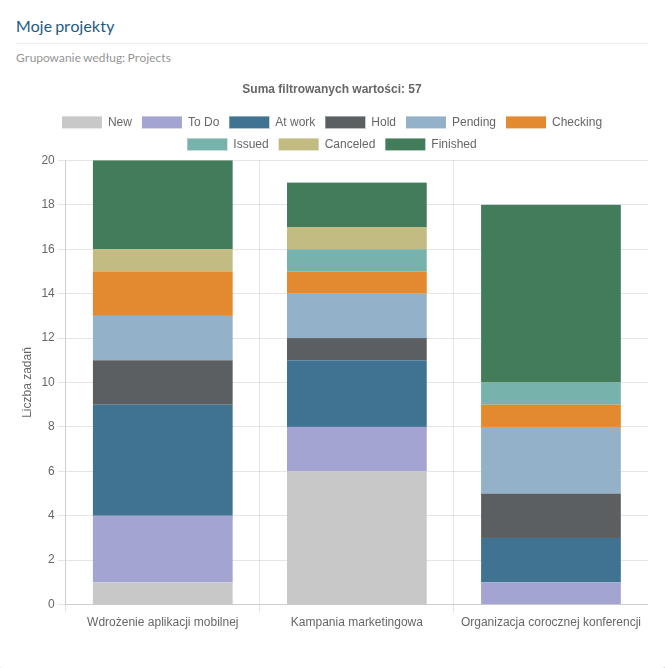
Its key element is the Break down by field, which allows data to be grouped dynamically by the most relevant criteria, including departments or projects. The configuration panel also provides a comprehensive set of task filters, allowing results to be filtered precisely by their main parameters.
The visual structure of the displayed data can be changed instantly using the dedicated Show statuses as separate bars toggle.
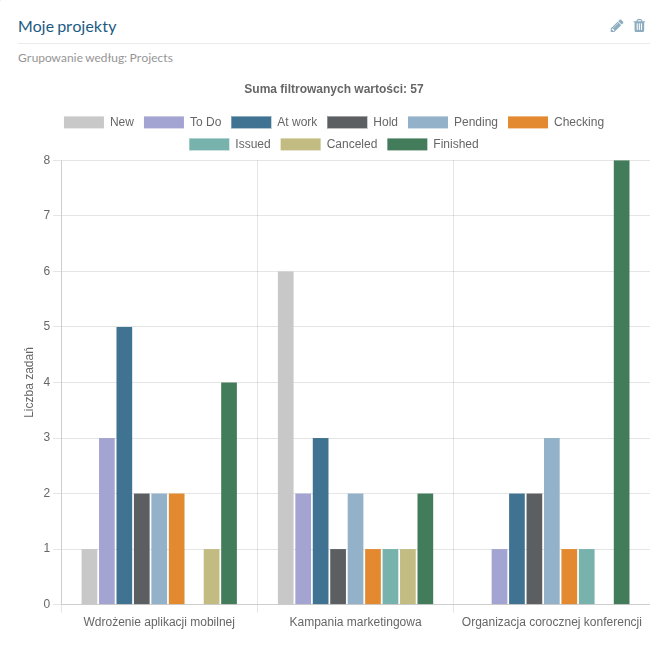
In line with the system’s security standards, the visibility of individual tasks and statistics is strictly governed by the permissions granted to the logged-in user, fully protecting sensitive company data from unauthorised access.
Explore other new features
Want to see this feature in action?
Book a free 30-minute demo and discover how the new version of Flowgres can improve your team’s workflow.
Book a demo →

