


Project reports and analysis
Flowgres delivers key data on projects, resources and progress in real time. Make sound decisions based on current metrics — with no manual data gathering and scattered files.
Project data always at hand — no tedious spreadsheets
Four pillars of analytics: status overview, KPI dashboards, schedule monitoring and advanced data filtering.
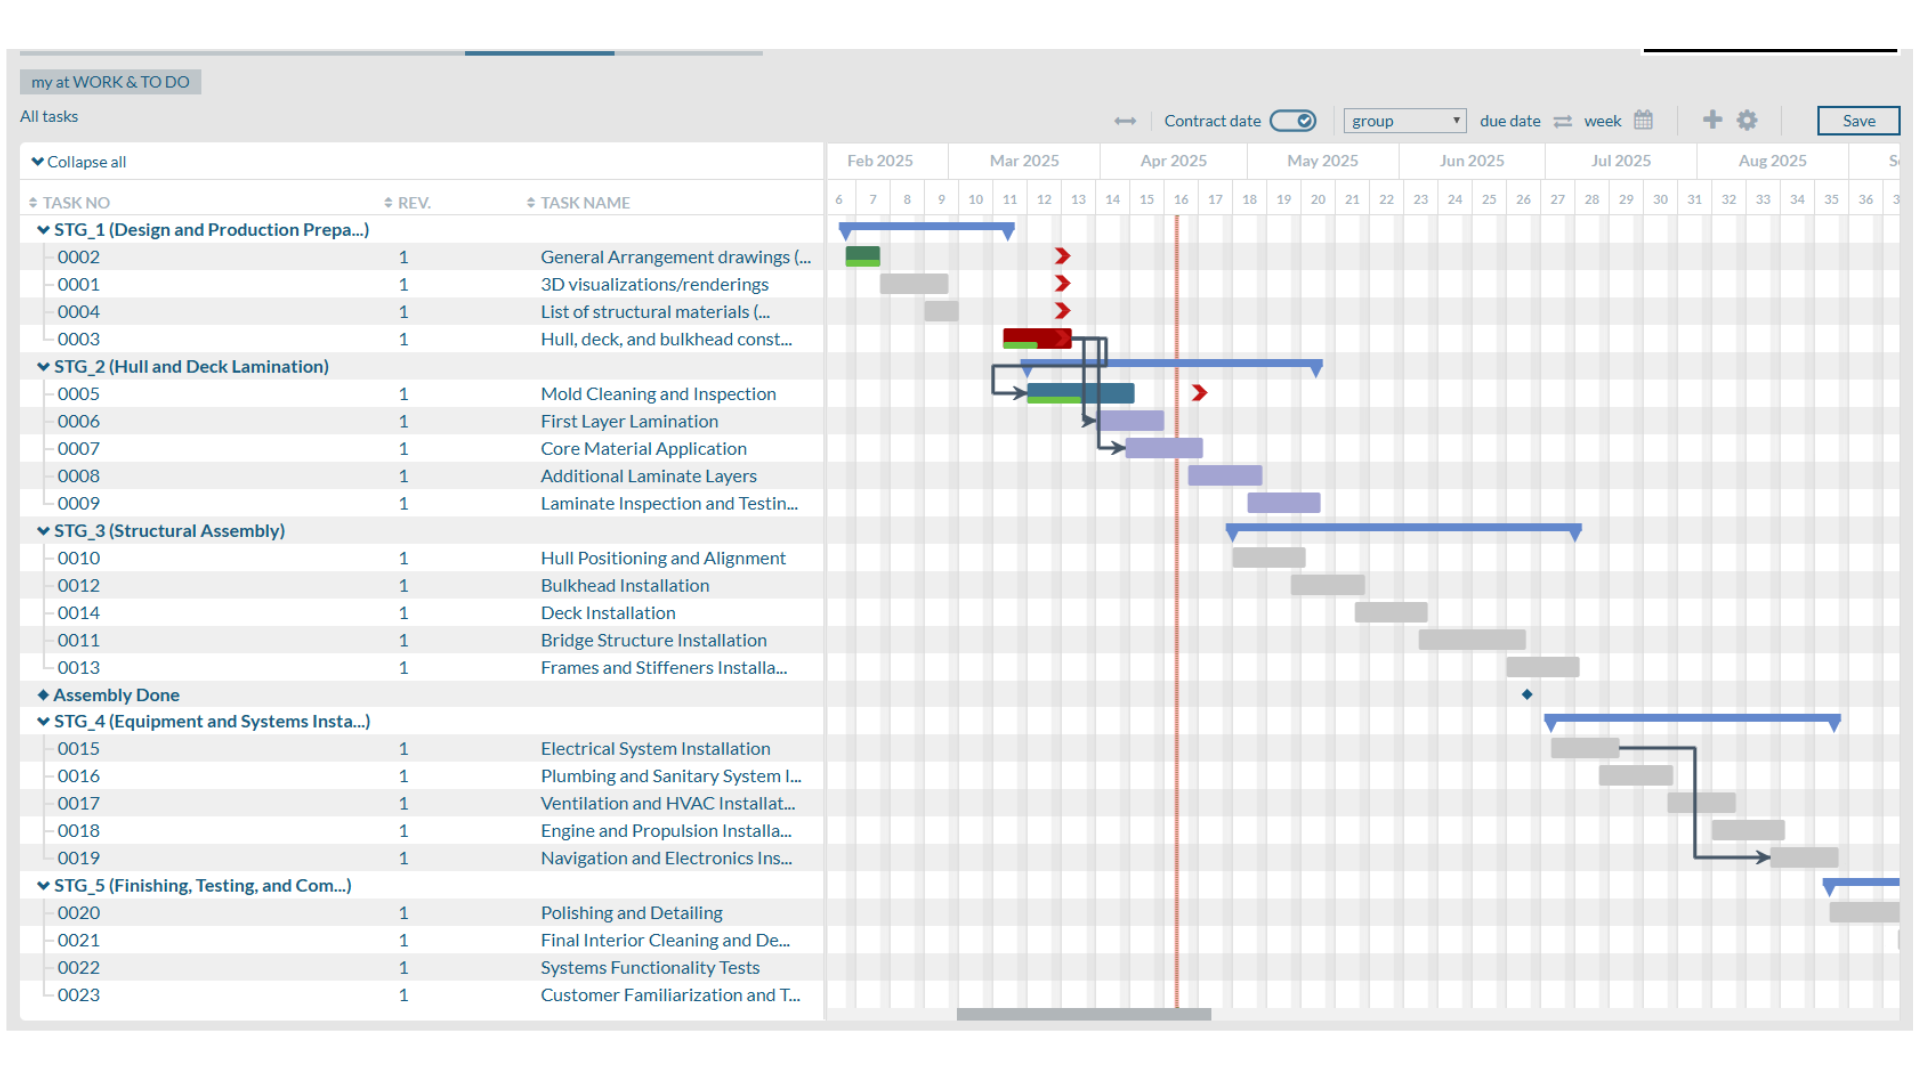
Overview of projects, statuses and progress
See where you stand with every project and process. Check statuses, deadlines, progress and accountability without switching between systems. Clear summaries help you instantly spot delays and identify what needs attention.
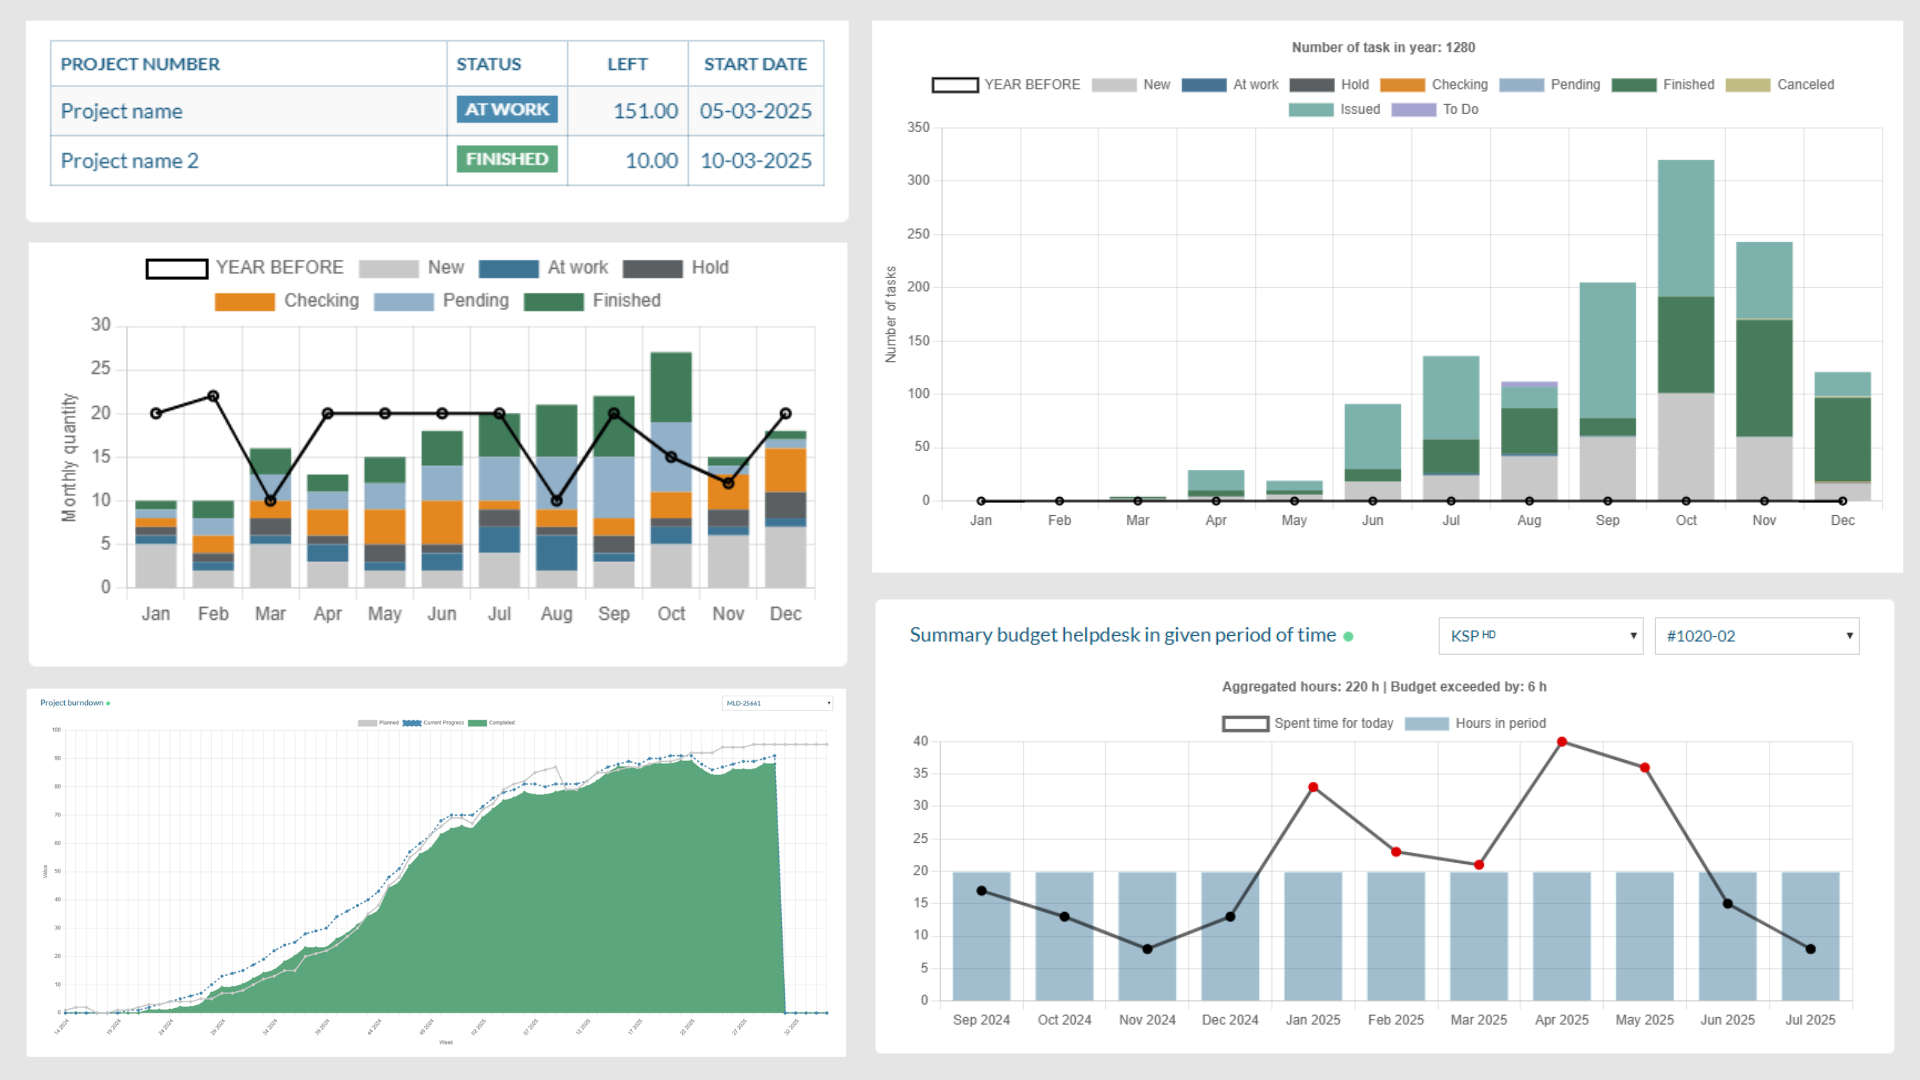
General and detailed dashboards
Get full insight into key metrics and the current state of your operations — from the big picture down to a specific process, project or team. Analyze KPIs, trends and results in real time. No tedious spreadsheets — data is always at hand.
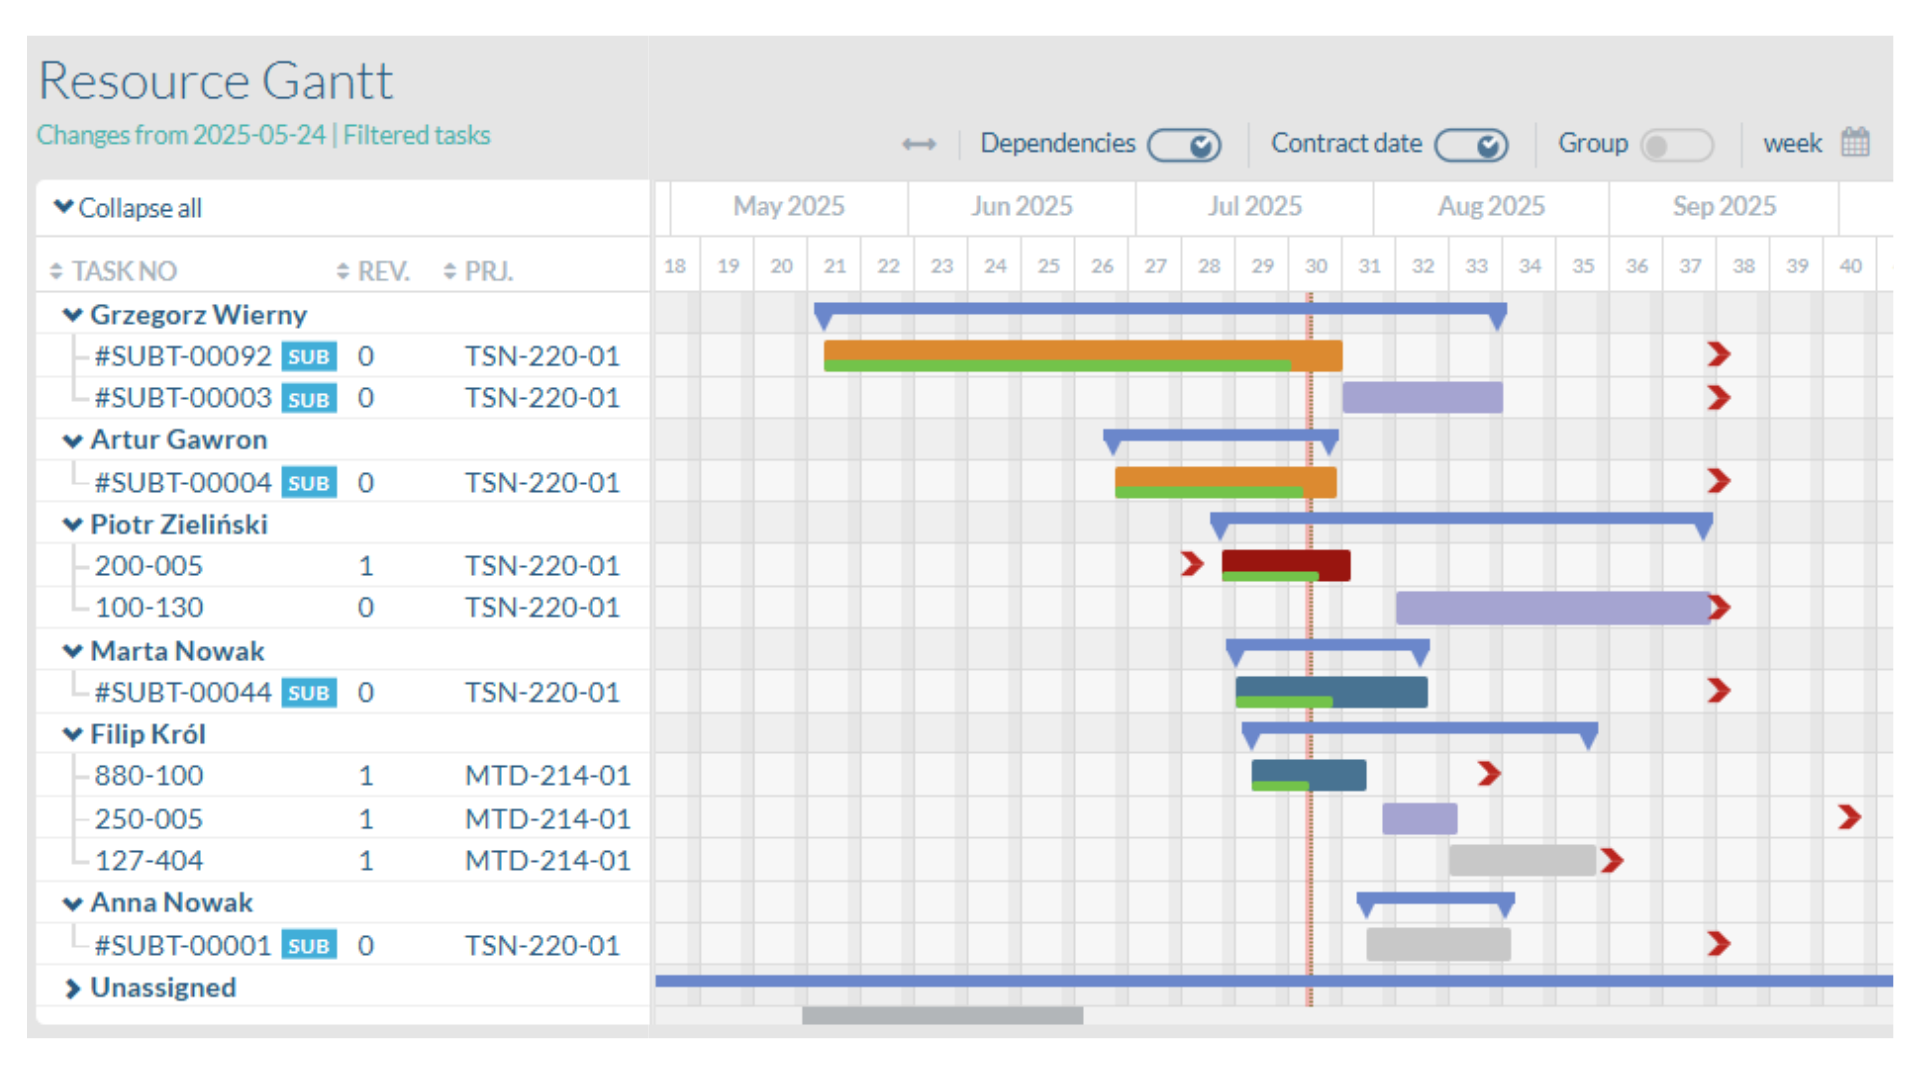
Monitoring project and resource schedules
Track how well work is following schedules — at the project level and in terms of resource involvement. See what's on plan, where delays or overloads are occurring, and react ahead of time before downtime appears.
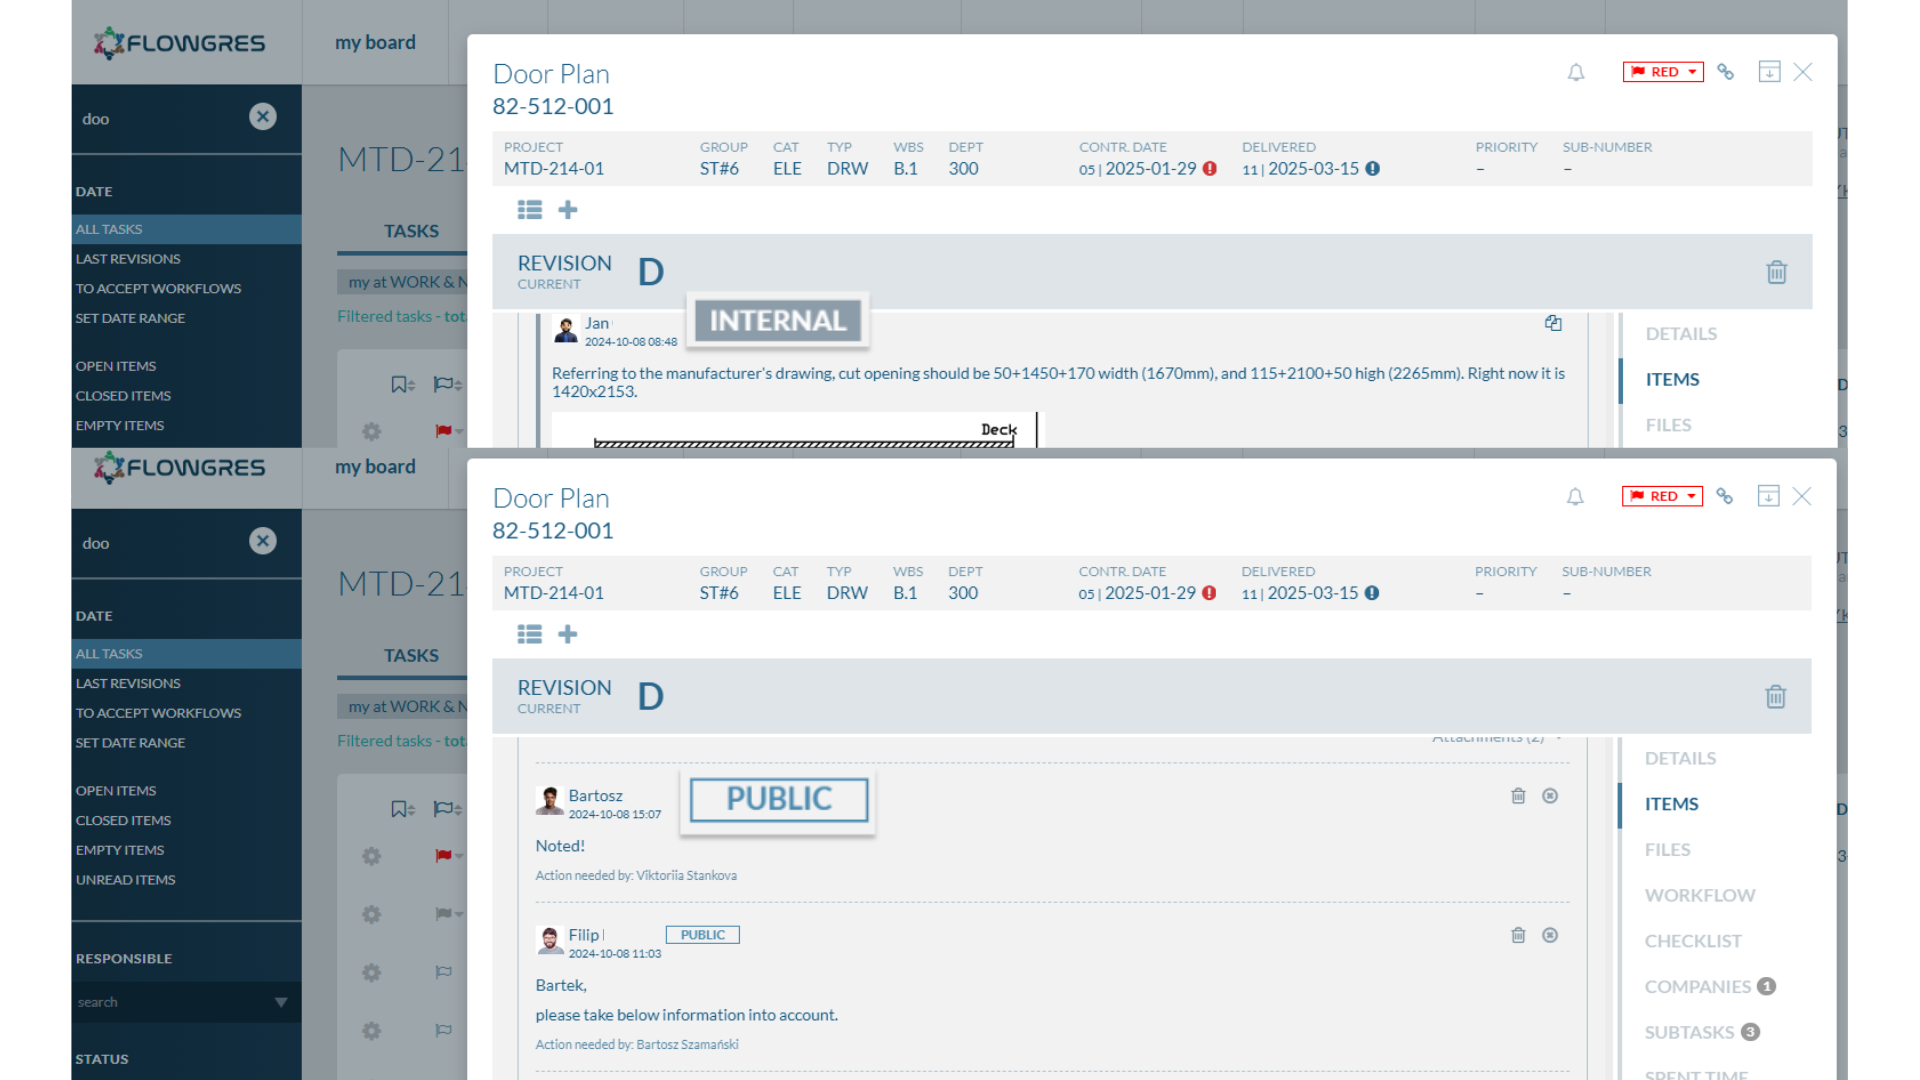
Advanced filtering and data sorting
Pick out exactly the data you need. Advanced filtering and sorting let you analyze by project, person, deadline, status or KPI value — quickly, precisely and without information noise.
A real operational edge
Fast access to metrics
Reliable data at hand — you don't waste time looking for it.
Less risk of delays and errors
Constant monitoring of progress and schedules limits surprises.
Optimal use of resources
Avoid overload and unused team capacity.
Automatic reports
No more manual data gathering — reports build themselves.
Full visibility of operations
Everyone knows what to do and when — one consistent view of projects, resources and schedules for the whole team.
Make fast, informed decisions
Four steps in which raw data turns into decisions and better schedules.
Collect data continuously
You always have up-to-date information on tasks, hours worked and budgets.
Monitor progress
Dashboards show project status, deviations from plan and pace of delivery.
Analyze resources
Check availability and allocation, avoid overload, plan the next tasks better.
Optimize actions
Shift deadlines, change priorities, bring in extra resources — based on data.
A consistent view of projects and resources in one place
Clear data
All data on progress, resources and schedules in a clear, integrated form.
Sound decisions
React faster to risks and better manage client expectations.
Full predictability
More projects finish on time — with less effort and greater predictability.
Automate your company's processes with Flowgres
Pick a convenient meeting time and see live how Flowgres turns data into decisions and ready-made reports.
Book a presentation →