


")
")
")
")
Learn about the changes to the Flowgres application
Learn about the changes to the Flowgres application
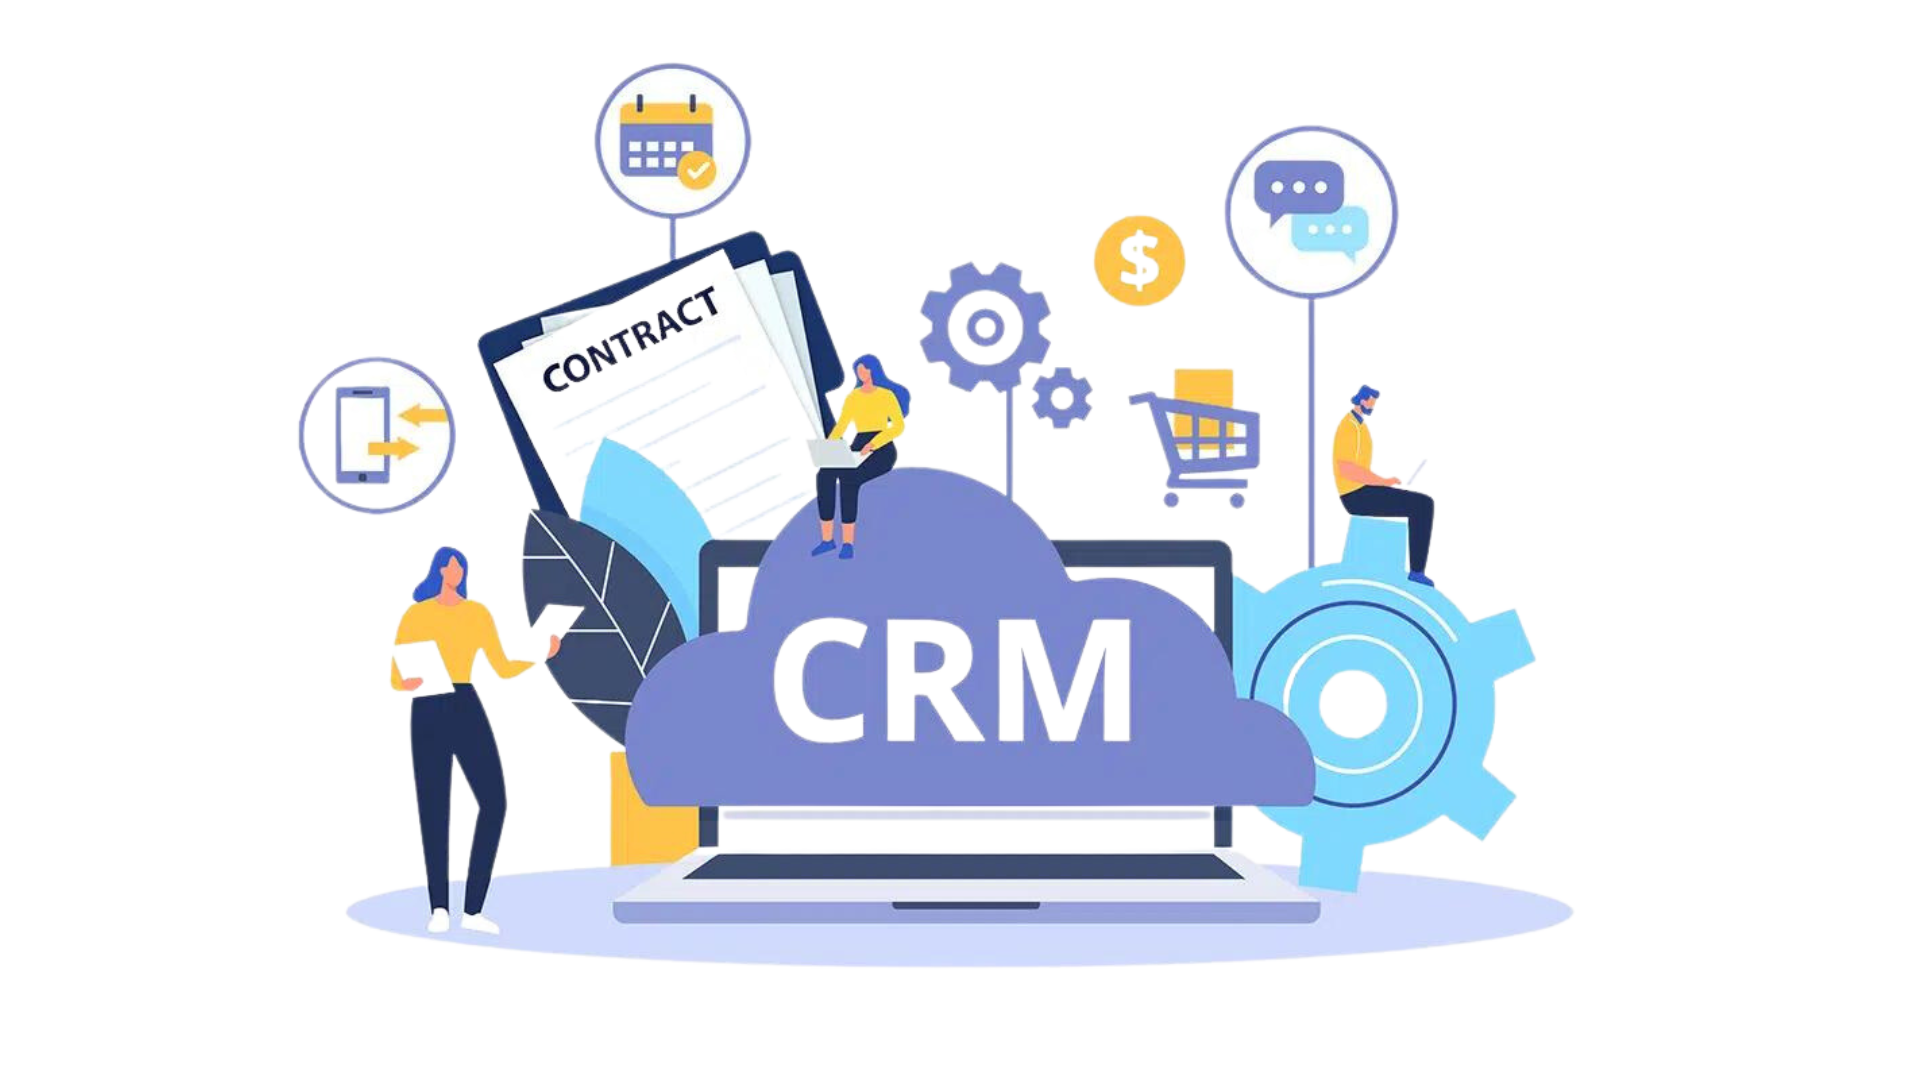
Flowgres provides key project, resource and progress data in real time.
Make accurate decisions based on up-to-date metrics
without manual data collection and scattered files.
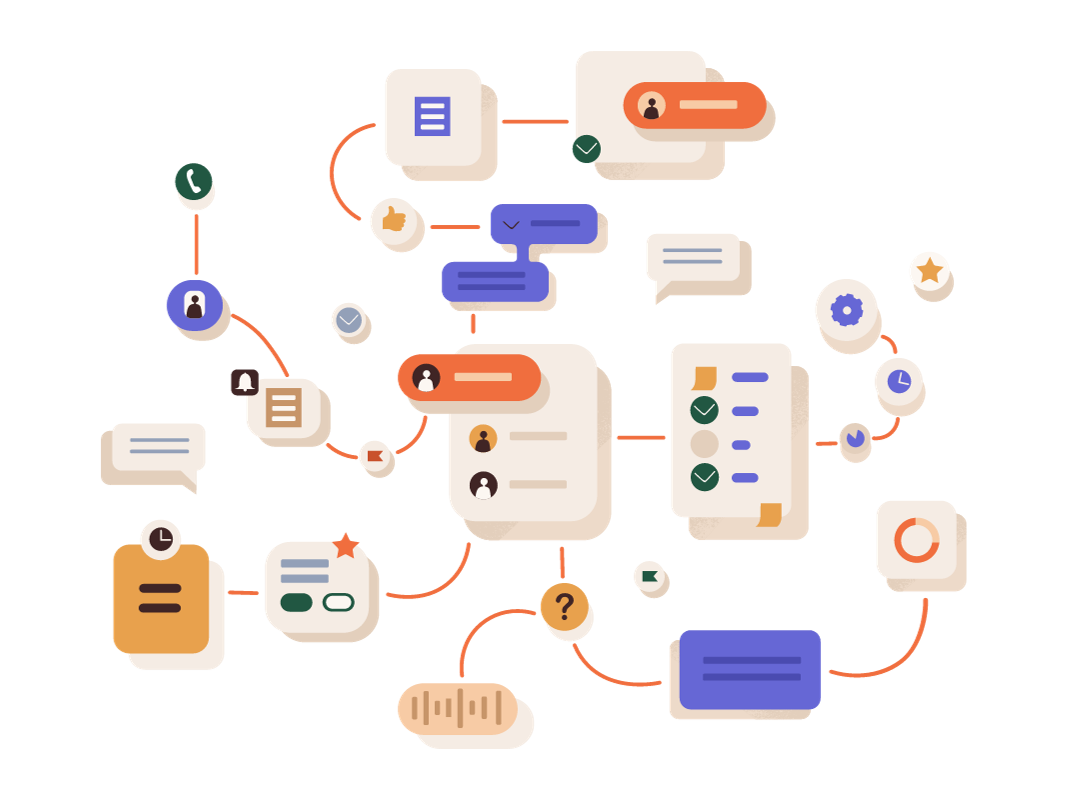
See where you are with each project and process.
Check statuses, deadlines, progress and responsibilities without switching between systems.
Instantly pinpoint delays and determine what needs intervention.
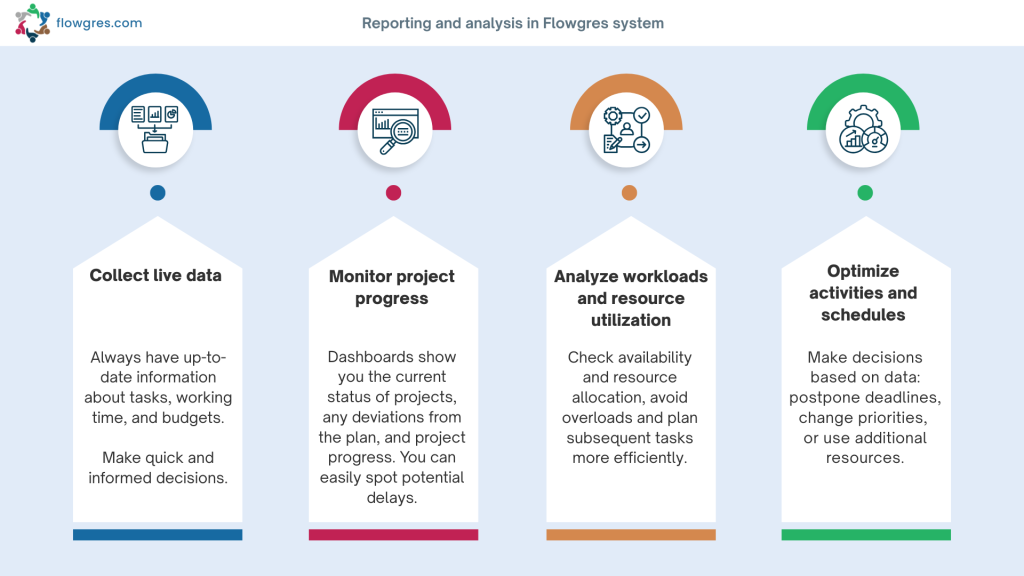
Gain a complete view of key indicators and the current status of operations, from the overall picture to the details of a specific process, project or team.
Dashboards allow you to analyze KPIs, trends and results in real time. No need for tedious compilations – you always have the data at your fingertips.
Track activities’ status in relation to schedules from the project and resource allocation point of view.
See what is going according to plan, where delays or overloads are occurring, and react in advance before downtime occurs.
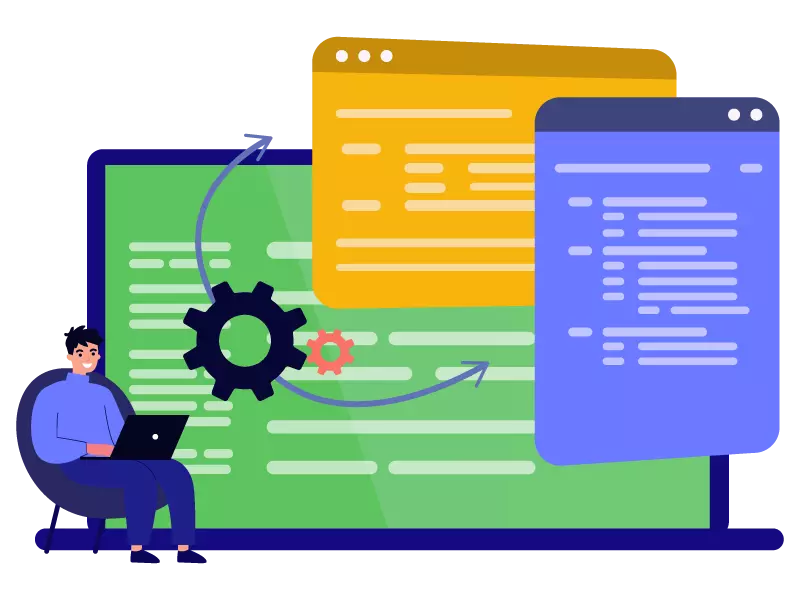
Choose exactly the data you need.
Advanced filters and sorting make it possible to analyze by project, person, deadline, status or KPI value – quickly, accurately and without information noise.
Smaller risk of delays and errors thanks to constant monitoring of progress and schedules
Optimal use of resources – avoid overload and unused potential
Automatic reports – no more manual data collection
All information on progress, resources and schedules is available in a clear, integrated form.
Make more accurate decisions, react to risks faster and manage customer expectations better.
More projects are completed on time, with less effort and more predictability.
Check out how Flowgres helps you gain
full visibility of projects, resources and deadlines
Our intuitive project dashboard allows you to quickly locate information about any project. Learn about status, dates, resources committed and more, all on one screen.
With a powerful reporting system, create personalized reports that provide you with key information. Analyze progress, resources, costs and other important aspects of projects in a way that suits your needs.
Exercise full control over project schedules and resource availability. Optimize your team’s work by adapting to the current needs of the project.
With a system of notifications and alerts, never miss important project events. Customize notifications to your preferences so you’re always a step ahead of potential challenges.
With Flowgres’ Project Overview and Reporting section, project management becomes not only efficient, but also intuitive and tailored to your unique business needs.